Optical Identifications and Studies of Infrared
Sources
![]()
![]()
Projects: Optical Identification and Study of IRAS PSC and
SST Sources, Spectroscopic Study of BIG and BIS Objects, Search and Study of Obscured IR Galaxies and ULIRGs
Years: 1995-
Team: A.M. Mickaelian, L.A. Sargsyan, K.S. Gigoyan, L.R. Hovhannisyan, S.A. Hakopian,
S.K. Balayan;
D.W.
Weedman, J.R.
Houck, D.
Barry; P. Véron,
M.P.
Véron-Cetty, A. Gonçalves;
E. Massaro, R. Nesci, C. Rossi; A.N. Burenkov, S.N. Dodonov, V.L. Afanasiev,
A.V. Moiseev
Collaborations: USA, France, Italy,
Russia
Facilities: IRAS, SST, FBS low-dispersion plates, DSS1/DSS2, DFBS, BAO 2.6m, SAO 6m, and OHP 1.93m telescopes, ESO-MIDAS,
software SMART, Asiago
and Loiano
telescopes
Presentations in 2005-2011: 33
Grants: ANSEF-2001:
A.M. Mickaelian (PI), Study of
Starburst/AGN/Interaction Phenomena in IRAS Galaxies
ANSEF-2011: L.A. Sargsyan (PI), Dust
obscuration and velocity distribution in narrow line regions of AGN
PICS travel grants, NSF/NASA
travel grants
Study of Extragalactic Infrared
Sources
A.M. Mickaelian, D.W. Weedman, J.R. Houck, L.A. Sargsyan
1.1
The Infrared Astronomical Satellite (IRAS, http://irsa.ipac.caltech.edu/IRASdocs/iras.html)
was launched on January 25, 1983. During its ten months of operation, IRAS
scanned more than 96 % of the sky for 4 times at four infrared bands centered
at 12, 25, 60 and 100 μm. IRAS detected about 500.000 infrared sources (included in two
catalogs; IRAS Faint Source Catalog (FSC) and IRAS Point Source catalog (PSC)).
So far, a big amount of this sources still are not
identified in optics. Since 1995 by A. Mickaelian in Byurakan Astrophysical
Observatory (BAO, , http://www.bao.am/) a project of optical identifications of IRAS point sources have been
started, using the low resolution spectra of FBS plates, DSS2 images and IRAS
fluxes. During last years the Digitized First Byurakan Survey (DFBS) plates
have been used. The list of almost 536 identified objects (10
lists) already are published. Simultaneously to the identifications, for
classifications of identified infrared sources, observations on 6-m telescope
(CAO, Russia, http://w0.sao.ru/),
1.93-m telescope (OHP, France, http://www.obs-hp.fr/welcome.shtml) and 2.6-m telescope (BAO, Armenia) were obtained (about 230 sources,
included in 5 published papers).
1.2. As part of efforts to determine the nature of faint infrared
sources, hundreds of spectra have been obtained with the Infrared Spectrograph
on Spitzer (IRS, http://www.spitzer.caltech.edu) of optically faint sources discovered at 24 μm with surveys using the Multiband Imaging Photometer (MIPS). The most
important result is that these faint sources having fν (24 μm) ~ 1 mJy are generally at high redshift,
typically z ~ 2. Most show the 9.7 μm
silicate absorption feature, but some have PAH emission features and some have
only a continuum with no detectable features. These results imply that the
sources are optically faint because they are both distant and obscured by dust.
The absorbed sources and the featureless, power-law sources have been
interpreted as obscured AGN. This interpretation implies that the surface
density of optically obscured AGN at high redshifts exceeds that for classical,
optically discoverable AGN by a factor of two to three in infrared surveys to fν (24 μm) 1 mJy. Extremely luminous starbursts have
also been found at z ~ 2 which appear similar to local starbursts in all
characteristics except luminosity. To understand these high redshift, dusty
sources and to interpret the Spitzer-discovered sources within scenarios
for evolution in the universe, it is essential to understand how the sources of
luminosity are distributed between AGN and starbursts among the overall
population of sources. This requires comparison with closer, brighter examples
for which AGN and starburst diagnostics within the IRS spectra can be compared
to information from other wavelengths. So far, the comparison samples which
show the most similar spectral shapes are the ULIRGS, but the ULIRGs have lower
luminosities and smaller redshifts than the sources at z ~ 2. The ULIRGs
observed with the IRS were chosen primarily on the basis of 60 μm fluxes from the IRAS and were not selected based on optical
characteristics. By A.M. Mickaleian (Byurakan
Astrophysical Observatory, Armenia), D.Weedman
(Astronomy Department, Cornell University, Ithaca, NY), J.R. Houck (Astronomy
Department, Cornell University, Ithaca, NY) and L.A. Sargsyan (Byurakan
Astrophysical Observatory, Armenia), as a part of the study of infrared galaxies,
a sample of extragalactic sources from the IRAS FSC which have the optically
faintest magnitudes (E≥18)
were selected by spatial coincidence with a source in the FIRST radio survey,
and 28 of these sources have been observed with the IRS. While an infrared
source is always detected with the IRS at the FIRST position, only ~ 50%
of the infrared sources are real FSC detections, as estimated from the number
of sources for which the flux on 25 μm
determined with the IRS is fainter than the sensitivity limit for the FSC.
Sources have 0.12 < z < 1.0 and luminosities (in ergs s-1)
between 43.3 and 46.7 on 5.5 μm, encompassing the
range from local ULIRGs to the most luminous sources discovered by Spitzer at
z ~ 2. Median properties of the sample having silicate absorption are
very similar to the ULIRG Markarian 231 in silicate strength and continuum
luminosity (Figure 1).
PAH luminosities are used to determine the starburst luminosity within
each source, and predictions from dusty torus models are used to determine the
AGN luminosity. Sources have similar bolometric luminosities arising from
starbursts and from AGN and are equally divided between sources dominated by
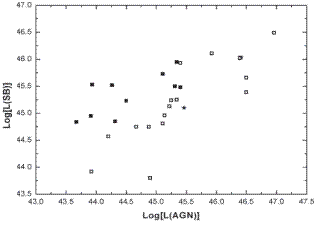
starbursts and sources dominated by AGN (Figure 2).
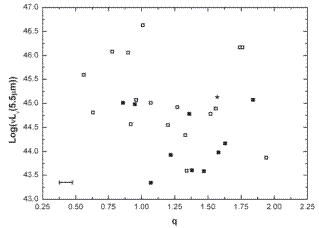
The ratio of infrared to radio flux is not a measure of whether sources
are dominated in the infrared by starburst or AGN luminosity (Figure 3).
|
|
|
|
|
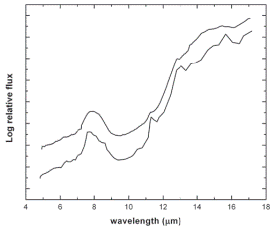
Figure 1. Comparison of Markarian 231 (top) with average of the 19 FSC galaxies
with measured silicate absorption (bottom),
arbitrarily normalized. |
Figure
2. Comparison of bolometric luminosities from AGN with those from
starbursts for FSC sample in Table 3, assuming that log[Lir(SB)] = log[L(6.2 μm)]+ 2.7 for PAH luminosity L(6.2) and that log[Lir(AGN)]
= log[L (5.5 μm)] + 0.33 for continuum luminosity L (5.5 μm). Filled squares are starbursts with PAH detections so the L(AGN)
derived from continuum luminosities are upper limits for L(AGN) because some
continuum may arise from the starburst; open squares are sources without PAH
detections so the L(SB) derived from PAH luminosities are upper limits for
L(SB) determined from upper limits on L(6.2). The star indicates Markarian
231. |
Figure
3. Comparison of luminosities and radio strength for FSC sources; q = log[f(25 μm)/f (1.4 GHz)] in observed frame. Filled squares are starburst sources
(as defined by PAH detections), and open squares are AGN (no PAH detections).
The star indicates Markarian 231. Uncertainties in q are typically ± 10%,
shown by the representative error bar, arising primarily from uncertainty
whether to adopt ”peak” flux or ”integrated” flux for the FIRST sources. |
Infrared Galactic Sources (stars with
infrared excess)
L.R. Hovhannisyan , D.W. Weedman , A.M. Mickaelian, E. Le Floc’h, J.R. Houck, B.T. Soifer,
K. Brand, A. Dey, B.T. Jannuzi
The sensitivity and efficiency of the Spitzer Space Telescope
(SST, http://www.spitzer.caltech.edu) has enabled numerous wide-area surveys to seek objects which are
unusually bright in the mid infrared when observed at 24 μm with the Multiband Imaging Photometer for Spitzer (MIPS). At
high Galactic latitudes, these surveys include the NOAO Deep Wide Field Survey
(NDWFS, http://www.noao.edu/noao/noaodeep/) in Bootes, the Spitzer Wide-area
Infrared Extragalactic Survey (SWIRE, http://www.ipac.caltech.edu/SWIRE/), and the Spitzer First Look Survey (FLS, http://ssc.spitzer.caltech.edu/fls/). To date, these surveys have been used only to locate unusual
extragalactic sources, primarily dusty star forming galaxies and active galactic
nuclei of very high luminosity. These surveys also include numerous bright,
Galactic stars. It is known from targeted observations with Spitzer that
some stars have mid-infrared excesses at 24 μm,
usually attributed to circumstellar dust arising in debris disks. By using
similar criteria for defining infrared excess as in these previous targeted
studies, it is possible to use the wide-area Spitzer surveys to produce
unbiased lists of stars with infrared excesses. The high latitude surveys are
especially useful, because they minimize confusion with other Galactic stars
and are in regions chosen to have low zodiacal background. By L. Hovhannisyan
(Byurakan Astrophysical Observatory, Armenia), D. Weedman (Astronomy
Department, Cornell University, Ithaca, NY), A. Mickaelian (Byurakan
Astrophysical Observatory, Armenia), E. Le Floc’h
(Steward Observatory, University of Arizona, Tucson, AZ), J.R. Houck (Astronomy
Department, Cornell University, Ithaca, NY), B.T. Soifer
(Spitzer Science Center, California Institute of Technology, Pasadena,
CA and Division of Physics, Mathematics and Astronomy, California Institute of
Technology, Pasadena, CA ), K. Brand (Space Telescope Science Institute, San
Martin Dr., Baltimore, MD), A. Dey (National Optical
Astronomy Observatory, Tucson, AZ) and B.T. Jannuzi
(National Optical Astronomy Observatory, Tucson, AZ) were identified Galactic
stars in the Bootes (128 sources) and FLS (140
sources) survey areas (the first two surveys for which was an access to
complete and reliable catalogs), giving in total a flux limited sample of
Galactic stars within an area of ~ 14 deg2 with r < 17 and fν (24μm) > 1 mJy. Among these stars, were
identified those which have excess fν
(24μm) compared to that expected from a stellar photosphere. In the combined
sample of 268 stars, 26 stars have excesses with (K-[24]) > 0.2 mag (K is
2MASS K magnitude). One star is a known variable; the remaining 25 stars have
0.2 < (K-[24]) < 0.7 and are candidates for having debris disks. Using
limits on absolute magnitude derived from proper motions, at least 12 of the
stars with excesses are main sequence stars, and estimates derived from the
distribution of apparent magnitudes indicate that 22 are main sequence stars.
These estimates lead to the conclusion that between 5% and 10% of the main
sequence field stars in these samples have infrared excesses (For main sequence
stars, such excesses are attributed primarily to debris disks). This result is
statistically similar to those from previous Spitzer targeted observations
of much brighter, main sequence field stars.
Further observations of the individual stars are needed, therefore, to
determine other possible sources of the identified excesses. This study
primarily demonstrates the utility of combining Spitzer surveys at 24 μm with 2MASS data for bright stars to accumulate a meaningful sample of
Galactic stars with apparent 24 μm excesses. Such a
statistical sample is essential to eventual understanding of debris disks
associated with solar-like stars and to discover other explanations of
mid-infrared excess luminosity, because only a small number of targeted stars
were observed with Spitzer to measure 24 μm
excesses. We are planning to observe these sources by 2.6m telescope of
Byurakan Astrophysical Observatory and Far Infrared Space Telescope (First, or
Herschel, http://herschel.jpl.nasa.gov/).
|
|
|
|
|
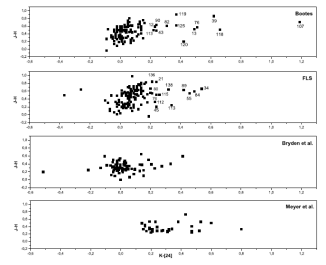
Figure 1. Upper panel: color-color diagram for all Bootes
sources identifying sources with (K-[24]) > 0.2 mag.; second panel: same
diagram for all FLS sources; third panel: same diagram for all field stars in
Bryden et al. (Bryden, G.
et al. 2006, ApJ, 636, 1098.); bottom panel: same
diagram for all stars with 24μm excesses in Meyer et al. (2008). Magnitude at 24 μm is
defined as [24], with zero magnitude of the MIPS 24 μm
fluxes corresponding to 7300 mJy. Stars with 24μm
luminosity arising only from the stellar photosphere should have (K-[24]) =
0. |
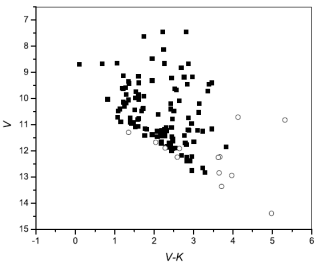
Figure
2. Distribution of V magnitude compared to V -K color for Bootes stars. Open circles identify objects with infrared
excess in Figure 1. Range of color arises from range of spectral types
included; A0 has V - K = 1, and M0 has V - K = 4.5. |
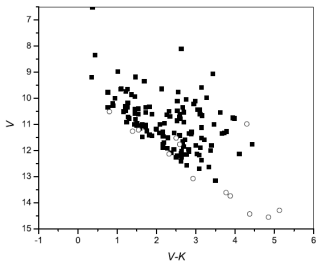
Figure
3. Distribution of V magnitude compared to V -K color for FLS stars. Open
circles identify objects with infrared excess in Figure 1. Range of color
arises from range of spectral types included; A0 has V - K = 1, and M0 has V
- K = 4.5. |